Data visualization software - where data meets simplicity
Create charts, maps, graphics, and content easily, regardless of database size. Gather actionable insights and engage your audience.
Get a free assessment.

What it takes to handle large datasets
Managing and analyzing large, complex datasets can be overwhelming. Without the right tools, businesses often face:
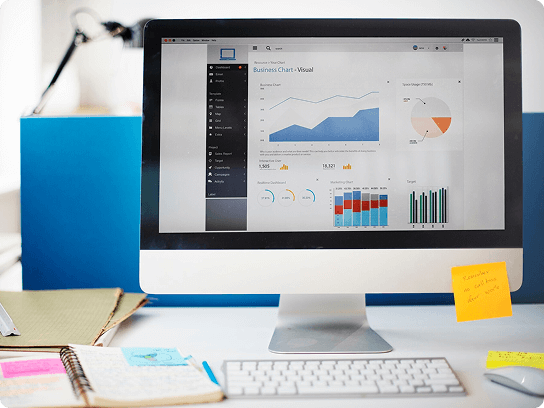
Complex data and information overload
Without up-to-date data, decisions are often based on outdated or incomplete information.
- Challenging to process increasingly large datasets (Big Data).
- Hard to make data comprehensible to stakeholders.

Limited technical expertise
Traditional tools, like Excel or reporting systems, struggle to handle large volumes of data.
- Performance issues such as slow processing times, lag, and difficulty to accommodate growing datasets.
- Hard to integrate data from various sources into a single, unified visualization.
Turn your data into actionable insights
We have a proven track record of developing data visualization software for German companies.
We listen to your needs, develop and deploy a ready product 5 times faster and cheaper than traditional development, and show you how to use our easy low-code method.
Data tools for all use cases
Create data visualizations from complex and vast datasets. We build visualization tools tailored to your needs in a few weeks, not months. We also empower users to manage easily after launch.
Data safety & compliance
We ensure all software on our platform is GDPR-compliant and data is safely managed. We can merge critical data at all touchpoints with your system for insights while adhering to the latest security standards.
Integration everywhere
Manage API integrations, data points, and workflows in one place. Move records to the cloud, extend systems, or bring all the tools in your stack together. Work with the confidence that you won’t have to start elsewhere.
Loved by businesses since 2015
Meet the companies that operate and digitize their services with ondeva.

From the start, the start-up platform was envisioned as a large-scale project built with ondeva. It was a complete success!
"Our giant baby performs and scales"
Claudia Menz, CEO Gründerplattform

An NGO can now compile complex data independently, flexibly, and in a clear manner - without development resources.
“You've finally freed us from Excel!”
Internationally operating NGO

ondeva helped us create web applications and tools for startups and the self-employed in weeks instead of months!
“Delivering digital tools is easy as 123"
Benjamin Wölfing / AC, Everest
Your data, clear and visual
Experience the perfect blend of fast-paced development and a solid tech foundation
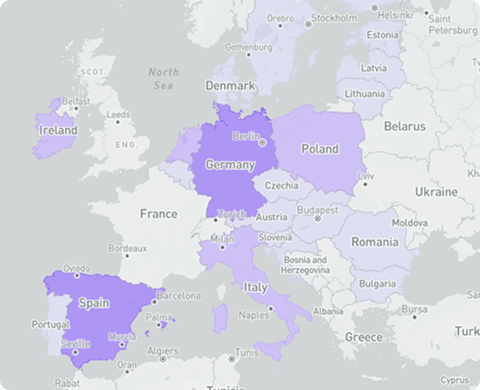
maps
Geo maps visualizing live data
Location maps are common knowledge in the Google Maps age. But you can add region-based information on top.
With our data visualization software, you can create the maps, overlays, and filters crucial to your application.
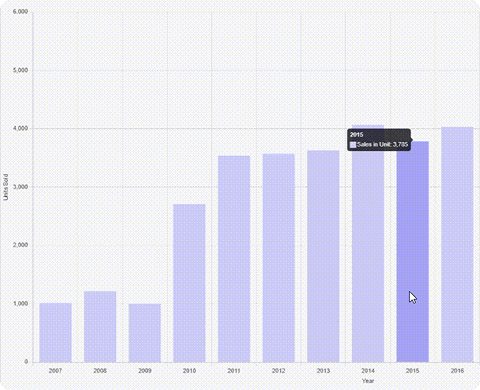
chart
Charts to visualize (company) data
Create pie charts, bar graphs, point charts and other graphics to show proportions and distribution.
You no longer need to request something from the development team because you can quickly implement it with the data visualization software.
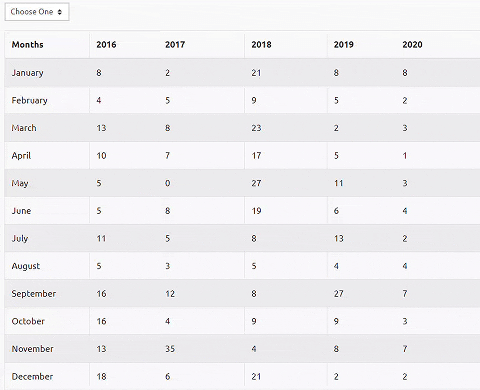
business intelligence
A representation of (business) data
Import massive datasets and provide an understandable and filter-resistant data analysis. Have your company's data ready when you need it for decision-making.
Understand your customers and business better.
From design to deployment in 4 simple steps
ondeva can build custom integrations 5 times faster and cheaper.


Assess
We analyze your project, your expectations, and requirements


Build
We develop the software in line with your requirements and budget using our proprietary low-code platform.


Deploy
We continuously deploy and integrate, starting with the most essential features.


Manage
If needed, we provide support post-release and build a long-term partnership with your non-technical users.
We’ll guide you along the way
Kickstart your project by building a strategic partnership with ondeva.

Schedule a call with Frank, our CEO, to learn about our offer.
Why choose ondeva data visualization services?
With ondeva visualization software
- Data Visualization
Transform your data into charts, graphs, and maps that immediately convey meaning. - Actionable Insights
ondeva helps you not just see your data, but understand it, uncovering actionable insights that can drive innovation. - Empowered Decision-Making
Visual data presentations enhance enables faster, more informed decisions based on clear insights. - Real-time Data Visualization
Stay ahead with the ability to visualize real-time data, allowing for immediate responses to trends or issues.
Without ondeva
- Complex Spreadsheets
Your data is trapped in spreadsheets. Data analysis is time-consuming and prone to errors. - Limited Insights
Hard to find valuable insights without visual context, limiting your understanding of critical trends and patterns. - Delayed Decisions
The difficulty to quickly grasp data insights can lead to slower decision-making processes, potentially missing opportunities. - Innovation Stagnation
It is challenging to identify areas for innovation or improvement.
Why clients trust us to build their projects
We solve complex problems using the latest technology.
A single platform for all your needs
Everything you need to create, test, deploy, and scale risk management software. You don't need multiple licenses and development tools.
Big Data apps
With sophisticated big data apps, you can get a holistic view of data and uncover insights. You can also reduce manual data entry and analysis and optimize business operations.
Scalability
As your usage grows, so does ondeva. We can handle traffic while maintaining performance. Scalability is built into our product, so you can go from tiny to tremendous without any interruption.
Visualizations
Create interactive maps, charts, and tables using the pre-loaded data. This dynamic data display allows users to visualize and analyze information in the way that best suits them.
Collaboration and coaching
We don’t just deliver but accompany you to ensure knowledge transfer. We help you keep building and improving services together with maintenance and support.
Workflow automations
Switch things up from offline to online and speed up your work. Automation takes care of the routine jobs, so your team can focus on hard tasks that need a human touch.
ondeva and data visualization software FAQs
Find answers to the most common questions about ondeva and data visualization software.
There are many data visualization tools. ondeva stands out as a simple and easy solution, offering flexibility, and the power to transform complex datasets into actionable insights.
For companies and organizations looking to make their database information accessible and understandable, ondeva provides a user-friendly platform that caters to all your data visualization needs.
When choosing data visualization software, make sure it works well with the types of data you use and can easily connect to your system. Look for software that is easy to use, allows you to customize your visuals, and grows with your needs. Check if it can work with other tools you use and if it has good customer support. Also, consider the cost and think about whether the investment will be worth it for your business.

